









Bitcoin's current bear market has extended past 230 days, entering its fourth-longest downward cycle since 2014.
According to CoinGecko data as of June 29, Bitcoin has been trading below its 200-day moving average (MA) for 238 consecutive days. CoinGecko defines a bear market as a period in which Bitcoin's closing price remains below its 200-day MA for more than 30 straight days. The ongoing slump marks the fourth-longest stretch among the seven bear markets recorded since 2014. The 200-day MA is a premier technical indicator used to identify long-term trends based on the average closing price of the previous 200 days. In general, asset prices trading below this line signal a prolonged medium- to long-term bearish trend.
Historically, Bitcoin's longest bear market occurred during the 2018-2019 cycle, lasting 385 days. That particular crypto winter was triggered by the bursting of the Initial Coin Offering (ICO) bubble in late 2017, which led to a sharp drop in retail demand alongside intensifying global regulatory pressure. The second-longest bear market spanned 381 days during the 2022-2023 cycle, driven by a systemic crisis of faith in the industry. Following the collapse of the Terra-Luna ecosystem in May 2022, a domino effect led to the bankruptcies of Three Arrows Capital, Celsius, and FTX, heavily damaging institutional trust. The third-longest stretch was the 321-day bear market of 2014-2015, catalyzed by the implosion of Mt. Gox, then the world's largest Bitcoin exchange, which shook the foundation of the nascent crypto market.
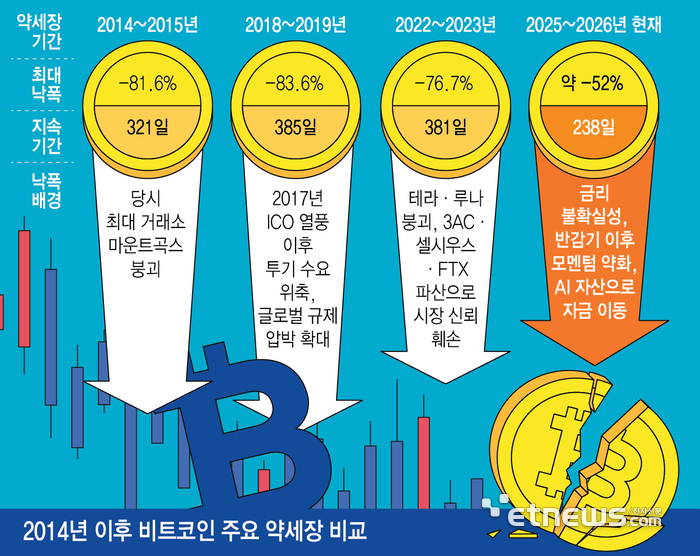
While the current bear market is proving to be a marathon, the actual price damage has been remarkably contained compared with previous crashes. CoinGecko data show that during this 2025-2026 cycle (as of the 24th), Bitcoin's maximum drawdown from its all-time high of $124,773 stands at 51.2%. This represents the mildest peak-to-trough decline among all seven bear markets since 2014.
In earlier major cycles, Bitcoin routinely suffered devastating 70% to 80% corrections. It plummeted 83.6% during the 2018-2019 bear market and 81.6% during the 2014-2015 cycle. The 2022-2023 downturn similarly wiped out 76.7% of its value, with prices sliding from an all-time high of $67,617 to a November 2022 bottom of $15,742. Even brief but high-impact panic events saw steeper drops. The 2020 COVID-19 crash lasted only 52 days but induced a 74.4% plunge. The 2021 correction triggered by China's mining ban saw a 52.9% drop--comparable to the current cycle--but that entire correction wrapped up in just 80 days.
CoinGecko attributes the current prolonged slump to a combination of persistent interest rate uncertainty, fading post-halving momentum, and speculative capital rotation into Artificial Intelligence (AI) assets. After hitting its latest all-time high in January 2025, Bitcoin's upward momentum decelerated as market liquidity shifted toward alternative high-growth asset classes.
The key indicator to watch now is whether Bitcoin can reclaim its 200-day MA. As of the 24th, Bitcoin's 200-day MA stands at $76,450, while its spot price trades at $62,651--a 22.0% gap. For Bitcoin to signal a definitive long-term trend reversal, it needs to rally more than 20% from current levels to break back above the moving average. In past cycles, it typically took between 65 and 166 days for Bitcoin to reclaim the 200-day MA once the macro bottom was established.
“While the shallow drawdown of this bear market may reflect a more resilient market structure, the cycle is not over yet, leaving the door open for potential further downside,” CoinGecko noted in its analysis.
